React DevTools for debugging
Overview
The React Developer tools (React DevTools) is a browser extension for Chrome and Firefox that provides a set of React specific inspection tools to assist you with your development process. In particular, you’ll get two main features: A React Component tree view of your app and the ability to check the current props and state of a selected component.
Getting started

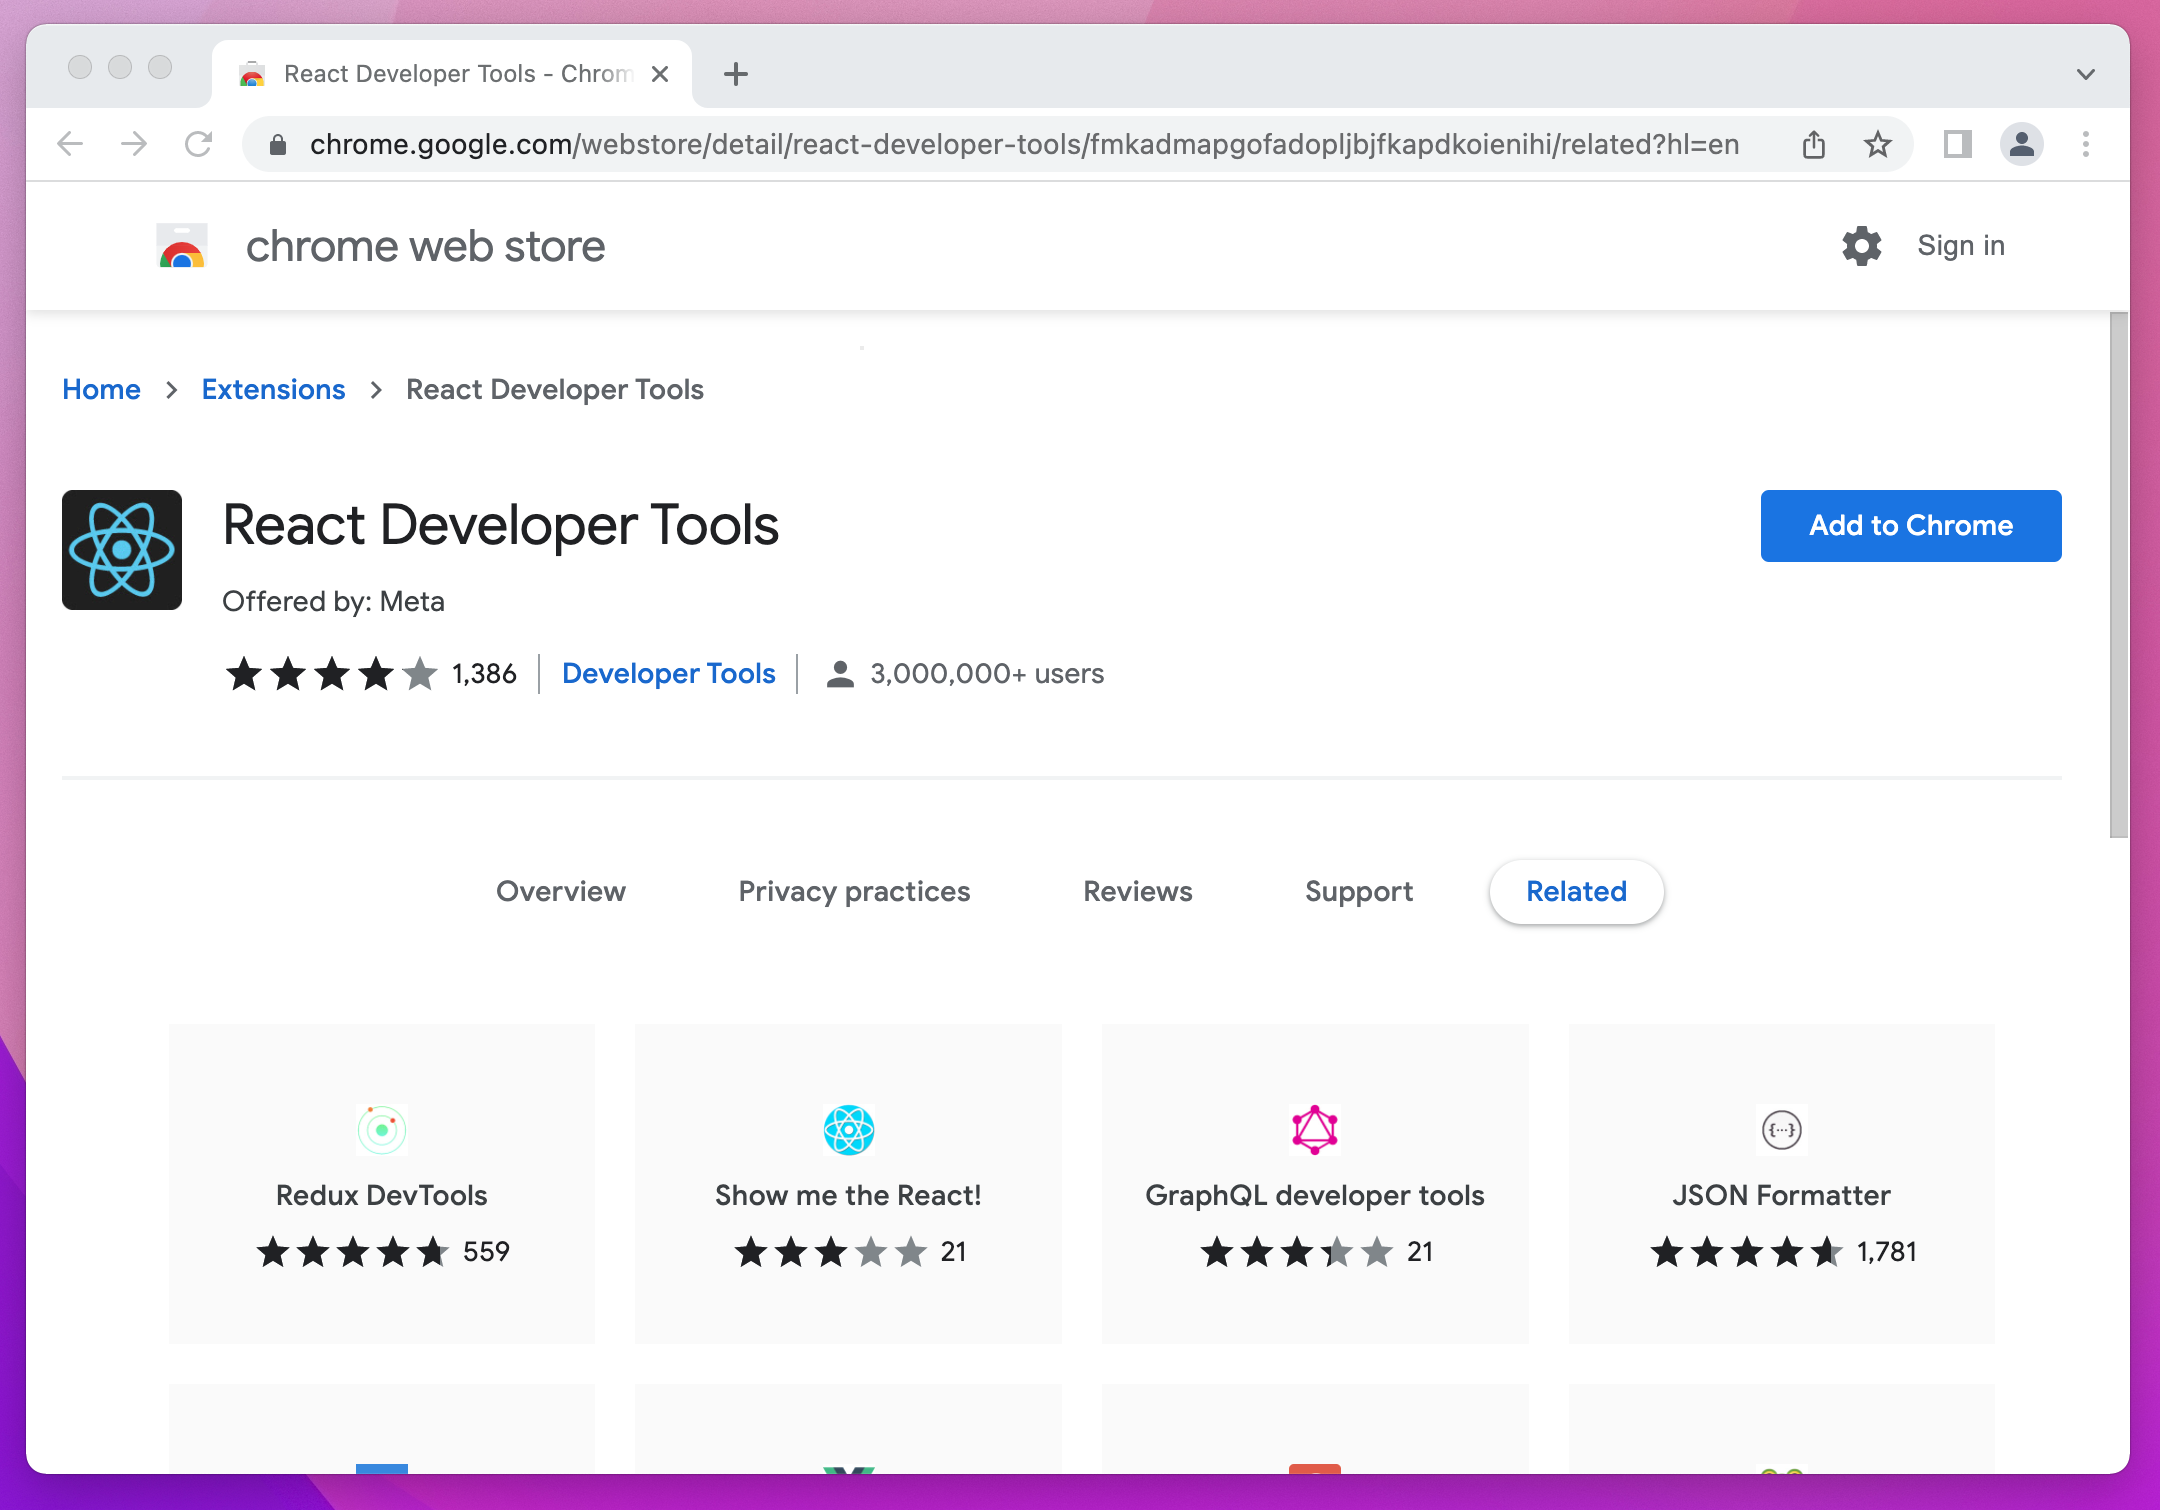
React DevTools extension for Chrome, we click the “Add to Chrome” button.
To install React DevTools, let’s visit the extension page for our browser of choice (Chrome or Firefox) and click the install button
After installing, you can right-click on any element on your app page, click “Inspect” to open the browser developer tools, and the React DevTools tabs (“⚛️ Components” and “⚛️ Profiler”) will appear as the last tabs to the right.

From https://react-devtools-tutorial.vercel.app/element-selector-tool
⚠️ The extension requires no additional setup. If you find yourself unable to access the tools after the installation, try restarting your browser or verifying that the tool can access the React instance on the page by clicking the React Logo on the address bar.
Exploring your App
The fastest way top open React DevTools is to right click your app page and select inspect.
On your browser’s inspection window, then select “⚛️ Components” and you will now be presented with a view of your App’s React components hierarchy:

This View of your App’s React components tree is very similar to an HTML tree you will see on the Elements tab, but with some React specific features.
Let’s explore those features!
Inline component selection
Selected React Components have a real time view of their state and props. This is great for troubleshooting. Also, you can see the component highlighted on the page.

As you explore your React Application, you can Double click on a given component to “Zoom” in further. The new Tree shown will contain only the elements that were rendered by the component. Click the “x” close button to return to the main component tree.
Editing Props and State
You can quickly test components by editing props and state within the DevTools. Relevant changes to a component props will be shown immediately.

Search & Filter Components

As your application grows, the component Tree may get complex or deep. Here’s where the search feature helps you find the component you want to explore.
You can also filter our components to focus on the ones you are interested in. By default, Host nodes (i.e: HTML <div>) are “hidden”. You can further customize this by click on the ⚙ settings icon:

After filtering out components, they are hidden from the tree view but will become visible after disabling the filter. This feature comes in handy when you work on a project with multiple components and fast sorting becomes a real need.
Console debugging
With DevTools, you can access React state from the console, as well as trigger callback methods and even augment functionality.
To use this, select a component in React DevTools and open the console (Hitting the escape key). Type $r, and you will have access to the instance of that React Component from the console.

Profiling
The DevTools profiler is a powerful tool for tuning performance of your React Components. It can help you identify parts of an application that are slow and may benefit from optimizations such as memoization.
You can profile the initial app mount with the “reload and profile” action:

The profiler displays a list of each time the component rendered during the profiling session, along with the duration for each render.
For a deeper dive into the profiler, we recommend watching React core team member Brian Vaughn’s live stream, where he demonstrates how to use the profiler to locate and fix performance bugs.
Read more
- Exercises to demonstrate the Features of React DevTools: https://react-devtools-tutorial.vercel.app/
- Browser Extensions:
- For a comprehensive list of features shipped with recent versions, see the official React DevTools changelog.
- In-depth blog showcasing how to profile React components with the React Profiler